The ICP is the world's largest global statistical initiative for estimating purchasing power parities (PPPs) to compare economic outputs, standards of living, and relative price levels across economies.
The ICP entails estimating purchasing power parities (PPPs) and related macro-economic aggregates of economies for comparison. The World Bank coordinates global-level ICP, while ADB covers the program’s Asia-Pacific component
The framework for the ICP in Asia and the Pacific is the same as the general approach to the ICP in all regions. The principal objective of the ICP is to provide policy makers, international organizations, economists, researchers, and the wider public with comparable measures of economic activity as measured by gross domestic product (GDP) and its components. The main problem for international comparisons is that data on GDP and its components are published in local currency units by statistical offices of the participating economies, making it difficult to compare across economies. GDP aggregates from economies are also influenced by differences in prices of goods and services that comprise GDP. The common practice on, and an intuitive approach to, international comparisons have been the use of market/official exchange rates to convert GDP data from economies into a common currency unit such as the United States dollar. While the use of exchange rates eliminates the problem of currency units, it fails to adjust for price level differences; this forms the crux of the problem encountered and effectively resolved in the ICP.
The ICP methodology is divided into three major components: expenditures as defined by the system of national accounts; prices of goods and services; and the actual methodology to compute PPPs. Following the framework of the ICP and standard methodologies, Asia and the Pacific implements the regional program and has developed practices and approaches to collect and compile price statistics and compute PPPs, real expenditures, and other ICP-related indicators.
The concept of GDP and its measurement is undertaken in various economies based on the internationally accepted standard, which is the 2008 SNA published by the United Nations, the Commission of the European Communities, the International Monetary Fund, the Organisation for Economic Co-operation and Development, and the World Bank.
GDP is a widely accepted measure of economic activity. According to the SNA, GDP can be measured using three different methods: production approach, income approach, and expenditure approach.
The ICP methodology is designed to provide volume measures for any desired component of GDP. Therefore, it is necessary to identify the level of disaggregation that is permitted within the ICP. As ICP provides measures of PPPs that convert a given aggregate into volume or real expenditure, the first and foremost requirement is to have an expenditure measure available at the aggregate being considered.
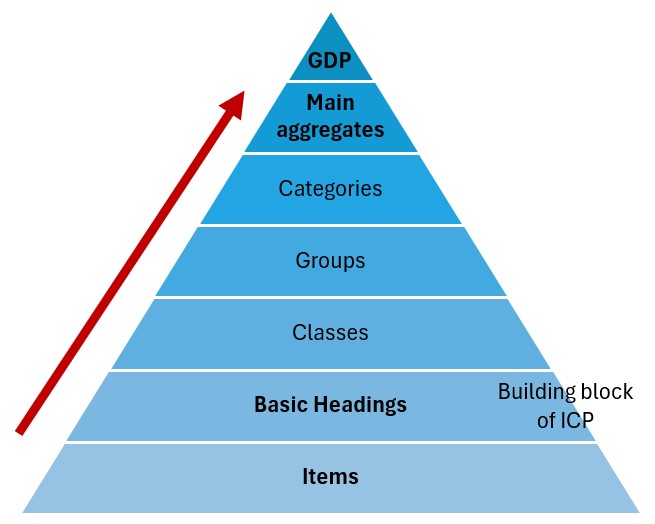
Basic headings are the lowest level of aggregation of items in the GDP breakdown for which expenditure data are available. They are the basis for estimating PPPs at higher level of aggregations, and are therefore known as the building blocks for ICP. Below the basic heading level, it may be possible to collect prices of items that make up the basic heading but estimates of expenditures are not usually available and/or not produced by most national statistics offices. For basic headings to be meaningful, it is necessary to group goods and services that are similar. However, in practice, basic headings may cover a broader range of products than what is desirable.
The ICP in Asia and the Pacific uses 155 basic headings following the ICP Global Office recommendations. In principle, the ICP methodology can be used to derive volume measures at each of the 155 basic headings or at aggregates that make up the basic headings. The ICP uses a hierarchical approach as shown in the pyramid figure.
National accounts data are at the core of international comparisons and serve two roles in the ICP. The primary objective of ICP is to provide comparable real expenditure aggregates obtained by converting expenditures in different economies expressed in their own currency units into a common currency unit. National accounts are the only source of data on expenditures in different categories at the national level. Therefore, the primary role of national accounts is to provide reliable estimates of expenditures. The ICP starts with the basic headings as the level at which expenditures are available and deemed reliable for most economies. The second role of national accounts is to provide weights necessary for aggregation of price data. The weights are the expenditures on each basic heading expressed as a share of GDP. As PPPs are computed using the national accounts, the accuracy and comparability of national accounts values and weights can impact on the accuracy and comparability of the PPPs.
For Asia and the Pacific, national accounts data validation was done at 2 stages: intra-economy validation carried out by the individual participating economies and inter-economy validation carried out by ADB. There was also a third level of inter-regional validation performed by the ICP Global Office.
The implementing agencies were required to submit GDP expenditures data for 155 basic headings from 2011 to 2017 using the ADB-developed GDP Price Collection Tool (PCT). The PCT had built-in validation checks which include additivity from the basic heading level to higher levels of aggregation; completeness of entries for the 155 basic headings; completeness of entries for the years 2011 to 2017; and presence of negative values where it was not expected or acceptable among others. The PCT also automatically mapped the 2011 to 2016 GDP data prepared using the 2011 ICP classification into the revised 2017 ICP classification whenever applicable. Other useful information in the PCT included methodology for estimating basic headings based on recommended splitting methods; confirmation of estimates with updated descriptions for the 2017 ICP such as vegetables basic headings. Likewise, the PCT flagged for review/confirmation absolute difference at the category and basic heading levels which exceeded specified thresholds and higher than expected category shares.
Two regional workshops were dedicated to analyze the economy estimates with technical advice from an international expert on national accounts. The hands-on session for economy validation and documentation was conducted in one of the regional workshops specifically to assist implementing agencies in GDP data validation. Documentation of estimation methodologies was deemed an important step taken by the implementing agencies for reference and guide in future ICP cycles.
Outside of the RIA’s and ICP Global Office’s validation tools, GDP and main aggregates levels data submitted by economies were validated with economy data in the ADB’s Key Indicator for Asia and the Pacific 2018 and the Compendium of Supply and Use Tables. The latter publication, which is an output of an ADB technical assistance was a valuable reference in compiling detailed estimates required by the ICP.
Revised data based on the comments/findings using the ADB and ICP Global Office GDP validation tools, verification with relevant ADB publications, discussions during the regional workshops and technical advice of the international national accounts expert all contributed to the submission of GDP expenditures data required for robust PPP estimation for the region.
References:The most important input into the computation of PPPs is the price data. In concept, PPPs are summary measures of prices of goods and services in the participating economies. Therefore, considerable efforts were exerted on the collection and validation of price data used in the computation of PPPs. As ICP covers the whole of GDP, which comprises household consumption expenditure, government consumption expenditure, and gross capital formation, it is necessary to devise price collection and validation procedures that are specific to each of these aggregates.
Household consumption. Household consumption is the most significant aggregate in the national accounts with an average share, over the 22 participating economies, of approximately 45% of GDP. It comprises 110 basic headings out of 155 basic headings for the GDP. The items in the product list for household consumption comprise (i) the regional product list with goods and services considered representative of consumption in the participating economies of the region and (ii) the global core list of products prepared by the ICP Global Office. A degree of overlap between the regional and global lists is desirable. The regional list for Asia and the Pacific comprises 887 goods and services whereas the global list comprises 415 items; the two lists share 296 products in common. The combined list of regional and global items comprises in total 1006 items, which are then priced by the participating economies.
Health and education. These are two components of household consumption where one part of the expenditure is incurred by the individuals and another through government provision. Across the 22 participating economies in the region, there is a diverse mix of government provision and the degrees to which these services are subsidized. The basic principle is that prices used for converting health and education expenditures should reflect market prices, regardless of who provides these services and at what price. The product list for health includes 174 goods and services and the global core list has 77 items. Similar to the 2011 ICP, pharmaceutical products from the ICP Global Office were split according to the brands priced for originator products, and the origin for the generic products. This resulted in 133 child items in the regional list from 57 parent pharmaceutical items in the global list. Therefore, participating economies had a total of 174 goods and services to price under the health category. For education, the product list consists of seven items and coincides with the global core list.
Housing or dwelling expenditure. It is difficult to make international price and volume comparisons for dwellings. Differences in national accounts practices in the treatment of owner-occupied housing and the lack of well-established rental markets make the task particularly complex. At the conclusion of extensive data collection and analysis by the RIA in Asia and the Pacific and at the recommendation of the Regional Advisory Board and Technical Advisory Group, the ICP decided that in the 2017 cycle, it will continue to use the reference volume approach used in the 2005 and 2011 cycles. During 2017 ICP cycle, the participating economies conducted rental surveys for use in implementing the rental approach. In parallel, data on a range of quantity measures of dwelling volumes and associated quality indicators were collected for use in the quantity approach. To implement the rental approach, rents were collected for 21 types of dwellings, of which 9 were houses (7 from global list and 2 specific to the Asia and Pacific region); 10 were apartments (5 global and 5 regional specifications); and 2 were traditional dwellings both with regional specifications. On the volume side, the standard volume indicators were used: number of dwellings per 100 people, number of rooms per 100 people, and square meters of usable floor space per person. In addition, quality indicators were used, measured by the proportion of dwellings with electricity, safe water, inside toilets, and several other quality indicators collected from United Nations sources on Sustainable Development Goals. The RIA developed a new approach that combined the rental and quantity approaches recommended for estimating PPPs for dwelling, and this approach will be implemented after further testing during the 2020 ICP.
Government consumption. The government consumption survey collects data on the annual average compensation paid to select set of government occupations providing a variety of individual and collective services to the public. The list of standard occupations used in the ICP for this aggregate is determined at the global level. There are a total of 35 occupations, of which 34 are from the global list; the occupation of “medical imaging and therapeutic equipment technicians” was added in Asia and the Pacific. However, after considering the problem of comparability of some occupations across economies of the region, the occupation of “senior government official” was dropped. The final list included 9 occupations from health, 5 occupations from education, and 20 occupations from collective services of the government.
Gross fixed capital formation: Machinery and equipment. Machinery and equipment is a component of GFCF, along with construction. The list for machinery and equipment is global and includes 196 products, 93 of which are unspecified and 103 of which are specified with details of make, manufacturer, and technical specifications. After evaluating variability in prices reported, the RIA and implementing agencies agreed to drop 16 out of 196 items from the list for which the price data was evaluated as not comparable in consultation with an expert on machinery and equipment. Further analysis of price data for unspecified items, led to a decision to split 26 unspecified items into two groups following established criteria based on price clustering.
Gross fixed capital formation: Construction. Construction consists of residential buildings, non-residential buildings, and civil engineering works. The input approach is used for construction in the region. For Asia and the Pacific, the region uses a regional list, which covers material inputs, equipment rental, and labor. The regional list is composed of 40 items for materials, 10 items for equipment rental, and 8 items for labor inputs. Out of 58 items, 55 items are from the global list and 3 are regional items. Indicators of relevance of material inputs in the different types of construction were used to identify the relevance of construction inputs for each type of construction. For example, only 30 material inputs out of 40 are considered relevant for residential buildings, 34 for non-residential buildings and 21 for civil engineering works.
The quality of price and national accounts data is paramount in compiling reliable PPPs and real expenditures. The RIA and the ICP Global Office take data validation quite seriously.
Validation at the Economy LevelThe national implementing agencies are responsible for checking price quotations for outliers and ensuring consistency in following the SPDs. The national agencies used software supplied by ADB, the ICP Asia and the Pacific Software Suite, which has extensive functionalities including the generation of survey questionnaires, data entry, basic data, validations, and diagnostics. The software also helped identify non-sampling errors such as units of measurement and data entry errors. Different price capture tools were also provided for data entry and basic validation on compensation, rental, machinery and equipment and construction surveys, and national accounts expenditure estimates.
Validation at the Regional LevelThe RIA employs a number of sophisticated statistical tools at the regional level to conduct checks on price data provided by participating economies.
Dikhanov tables. Dikhanov tables use residuals from the CPD regressions discussed in the section on index number methods for computing PPPs. These tables make use of residuals from CPD regression at the basic heading level; and residuals from CPD regressions for higher level aggregates such as whole household consumption, government compensation, construction, and machinery and equipment to identify outliers among the PPP ratios and provide measures of price variations for products and economies.
Price changes in the consumer price index versus the International Comparison Program. The RIA developed this novel technique for Asia and the Pacific during the 2011 ICP cycle and further refined and used it to its full potential during the 2017 ICP cycle. Basically, the tool exploits the fact that there are a large number of goods and services in common in the product lists of 2011 and 2017. For each economy, there are prices for a common set of items in 2011 and 2017 which can be used in computing an estimate of price change based on ICP products, labeled ICP inflation. During the same period, domestic inflation data based on CPI, CPI inflation, is available as an independent measure of price change from 2011 to 2017. While the ICP and CPI inflations would not be identical, there is an expectation that these two measures not diverge widely. Based on this, the RIA used differences between ICP and CPI inflation as a validation tool and urged participating economies to verify these differences and document the source of deviation as a part of data editing and checking.
References:In calculating PPPs for each basic heading, the only data available are the prices of items included in the basic heading. It is almost impossible to collect data on expenditures or quantities consumed in the whole economy at the item-level. Also, not all items in the basic heading are priced in all economies. Economies usually price only a subset of items in a basic heading, generally those items which are representative of expenditures for that basic heading.
The ICP uses the country-product-dummy (CPD) method—recommended by the Technical Advisory Group since the 2005 cycle—for aggregating item-level price data to compute PPPs at the basic heading level. Details of the method along with a comparison of its properties with other methods are in Rao (2013). The method regresses the logarithm of observed prices on country-specific and product-specific dummy variables, hence the label country-product-dummy method.
Reference Purchasing Power Parities for Some Basic HeadingsOut of the 155 basic headings used in the ICP, there are some basic headings for which it is difficult to (i) specify the products and (ii) collect product prices that can be used in the CPD model. In such instances, PPPs of other basic headings which are considered similar are used as proxies or reference PPPs. For example, PPPs for the basic heading "maintenance and repair of dwelling" serve as a reference PPP for repair of household appliances.
Computing Purchasing Power Parities for Higher Level Aggregates: The Gini-Éltető-Köves-Szulc MethodTo compute PPPs at higher levels of aggregation, it is necessary to identify the aggregate of interest first and then consider all the basic headings that make up this aggregate. If the aggregate "food and non-alcoholic beverages" is of interest, then it is necessary to include all the 29 basic headings that comprise this aggregate. Similarly, if GDP is of interest, then all the 155 basic headings are included.
Since the 2005 ICP cycle, the Technical Advisory Group has recommended using the GEKS method as the index number method to compute PPPs for higher level aggregates above the basic heading. The GEKS method builds on the well-known Fisher binary index number formula, chosen because it satisfies a number of axiomatic and economic theoretic properties, including the country reversal test, factor reversal test, and commensurability test. The Fisher index is also known to be superlative from an economic theoretic viewpoint (Diewert 2013).
Productivity Adjustment Method for Wages and Salaries of Government EmployeesThe RIA at ADB championed the need for productivity adjustment for comparisons of government compensation. In the 2005 ICP in Asia and the Pacific, the RIA observed that wages and salaries of government employees in many low income economies of the region were too low, resulting in lower price levels and higher volume or real expenditure measures of government expenditure. In some instances, the real per capita government expenditure in some low income economies were at implausibly high levels, most likely because the low wages in fact reflect low productivity levels of employees in these economies, which in turn reflect low levels of capital employed per labor unit. In the 2017 ICP cycle, Inklaar further refined the method of productivity adjustment factors which addresses the deficiencies of the method used in the 2005 and 2011 ICP cycles (Inklaar, 2019).
References:The ICP is the world's largest global statistical initiative for estimating purchasing power parities (PPPs) to compare economic outputs, standards of living, and relative price levels across economies.
View ICP governance
These present the ICP reports and related research presenting methodologies and results of purchasing power parities (PPPs) across various ICP cycles in Asia and the Pacific and related research such as studies on poverty-specific PPPs, integrating ICP with the Consumer Price Index as a framework for subnational PPPs, and alternative approaches for estimating PPPs for non-benchmark years in the region.
ICP Reports and ResearchGuide on the Integration of CPI and ICP Activities
ICP COVID-19 Guidance Note on Price Surveys
ICP COVID-19 Guidance Note on National Accounts
Expenditure Data